ED 4760 - Final Integration Project
Data Analysis and Graphing Using Real Local Data for Education
Project Overview
Driving Question: How can using real local data in data analysis and graphing activities motivate and enhance the learning of students?
My project was to build a set of remote wireless sensors to gather real weather data from the local area, and then learn to harvest this data and present it to students using student accessible language and tools. I wanted to ensure that the data was publicly accessible for anyone to use, be that students, fellow teachers, or the general public. I will build lessons to teach students to analyze that data using spreadsheets, specifically Google sheets since it is free, accessible, and does not require software to be installed. Students will also learn to present their findings.
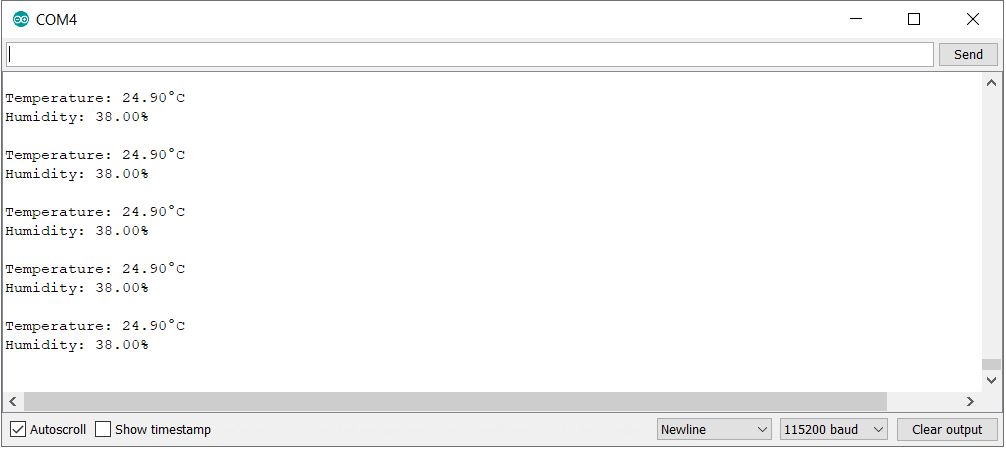
The first part of my project, building the sensors, consisted of designing, building, and programming two sensor modules that gather temperature and humidity data. While the microcontroller used was familiar to me, the sensor used was not and thus was a new learning experience for me. I also needed to construct a suitable housing for the sensors so that accurate data could be gathered in the harsh outdoor environment without being affected by direct and reflected sunlight falling upon the sensors.
The second part of the project focused on my learning to harvest the data and present it to students in an accessible format. While the data hosting platform, called ThingSpeak, used was familiar to me, I was only familiar with uploading data. Retrieving the data and harvesting large amounts of data from ThingSpeak was a new learning experience for me. I also wanted to ensure, during this step, that I made my enclosure designs and data accessible to other learners, teachers, and the general public who might also want to make use of them.
The third part of my project was to build lessons, and learn to do the data analysis myself using freely accessible tools, rather than paid ones, so that those free tools can be the ones I teach students to use as part of their learning of the concepts of graphing and data analysis.
Background
The cliché or stereotypical student response is that of, “But where will I actually use this in the real world?” Taking real weather data that students see, observe, and feel each and every day, data which affects them and those around them, seems like a great start to ending the question of whether you can use this weather data in the real world. Using the lessons and sensors I developed, not only will the students be using actual data (rather than canned data out of some book) that was measured live within their community, they’ll also be building real world skills in tools like spreadsheets, but not just specific skills, transferable skills in analysis that they can use in their own personal life and in many jobs.
Another big part of this project for me was ensuring the data and tools were open and accessible. Should another teacher, a learner, or just the general public want access to the data from the sensors or the tools used to process the data, I wanted them to have no obstacle to prevent their use. This way any learner, young or old, can continue their learning at no cost, especially important for young learners who might not be able to continue their learning at home, for classwork or exploration and learning on their own, if they were required to purchase expensive spreadsheet software. By making all of my lessons and data accessible and free, I hope that it can encourage learning as much as possible.
For this project my main aim is at the grade 10 mathematics and science classroom, though this technology application could easily be used in grades 9-12 mathematics, science, and physics, as well as in younger mathematics courses too where it also can help meet learning outcomes (for example, grade 6 statistics and probability (data analysis) outcomes). The specific curricular links/outcomes from the grade 10 mathematics, science, and ICT programs of studies are listed below in the Education Activities Using Sensor Data section.
The Sensors
Each sensor unit is run by an ESP8266 microcontroller as part of a Wemos D1 Mini board. The ESP8266 is the brains of the sensor, gathering the data and providing a WiFi radio to connect to a network and send the data to the ThingSpeak service online. The sensing of both temperature and humidity is taken care of by a DHT11 sensor connected to the microcontroller board. Shown below are the two modules connected together via Dupont cables, with a small piece of insulating tape in between to prevent shorting the DHT11 module against the shielding of the micro USB connector.
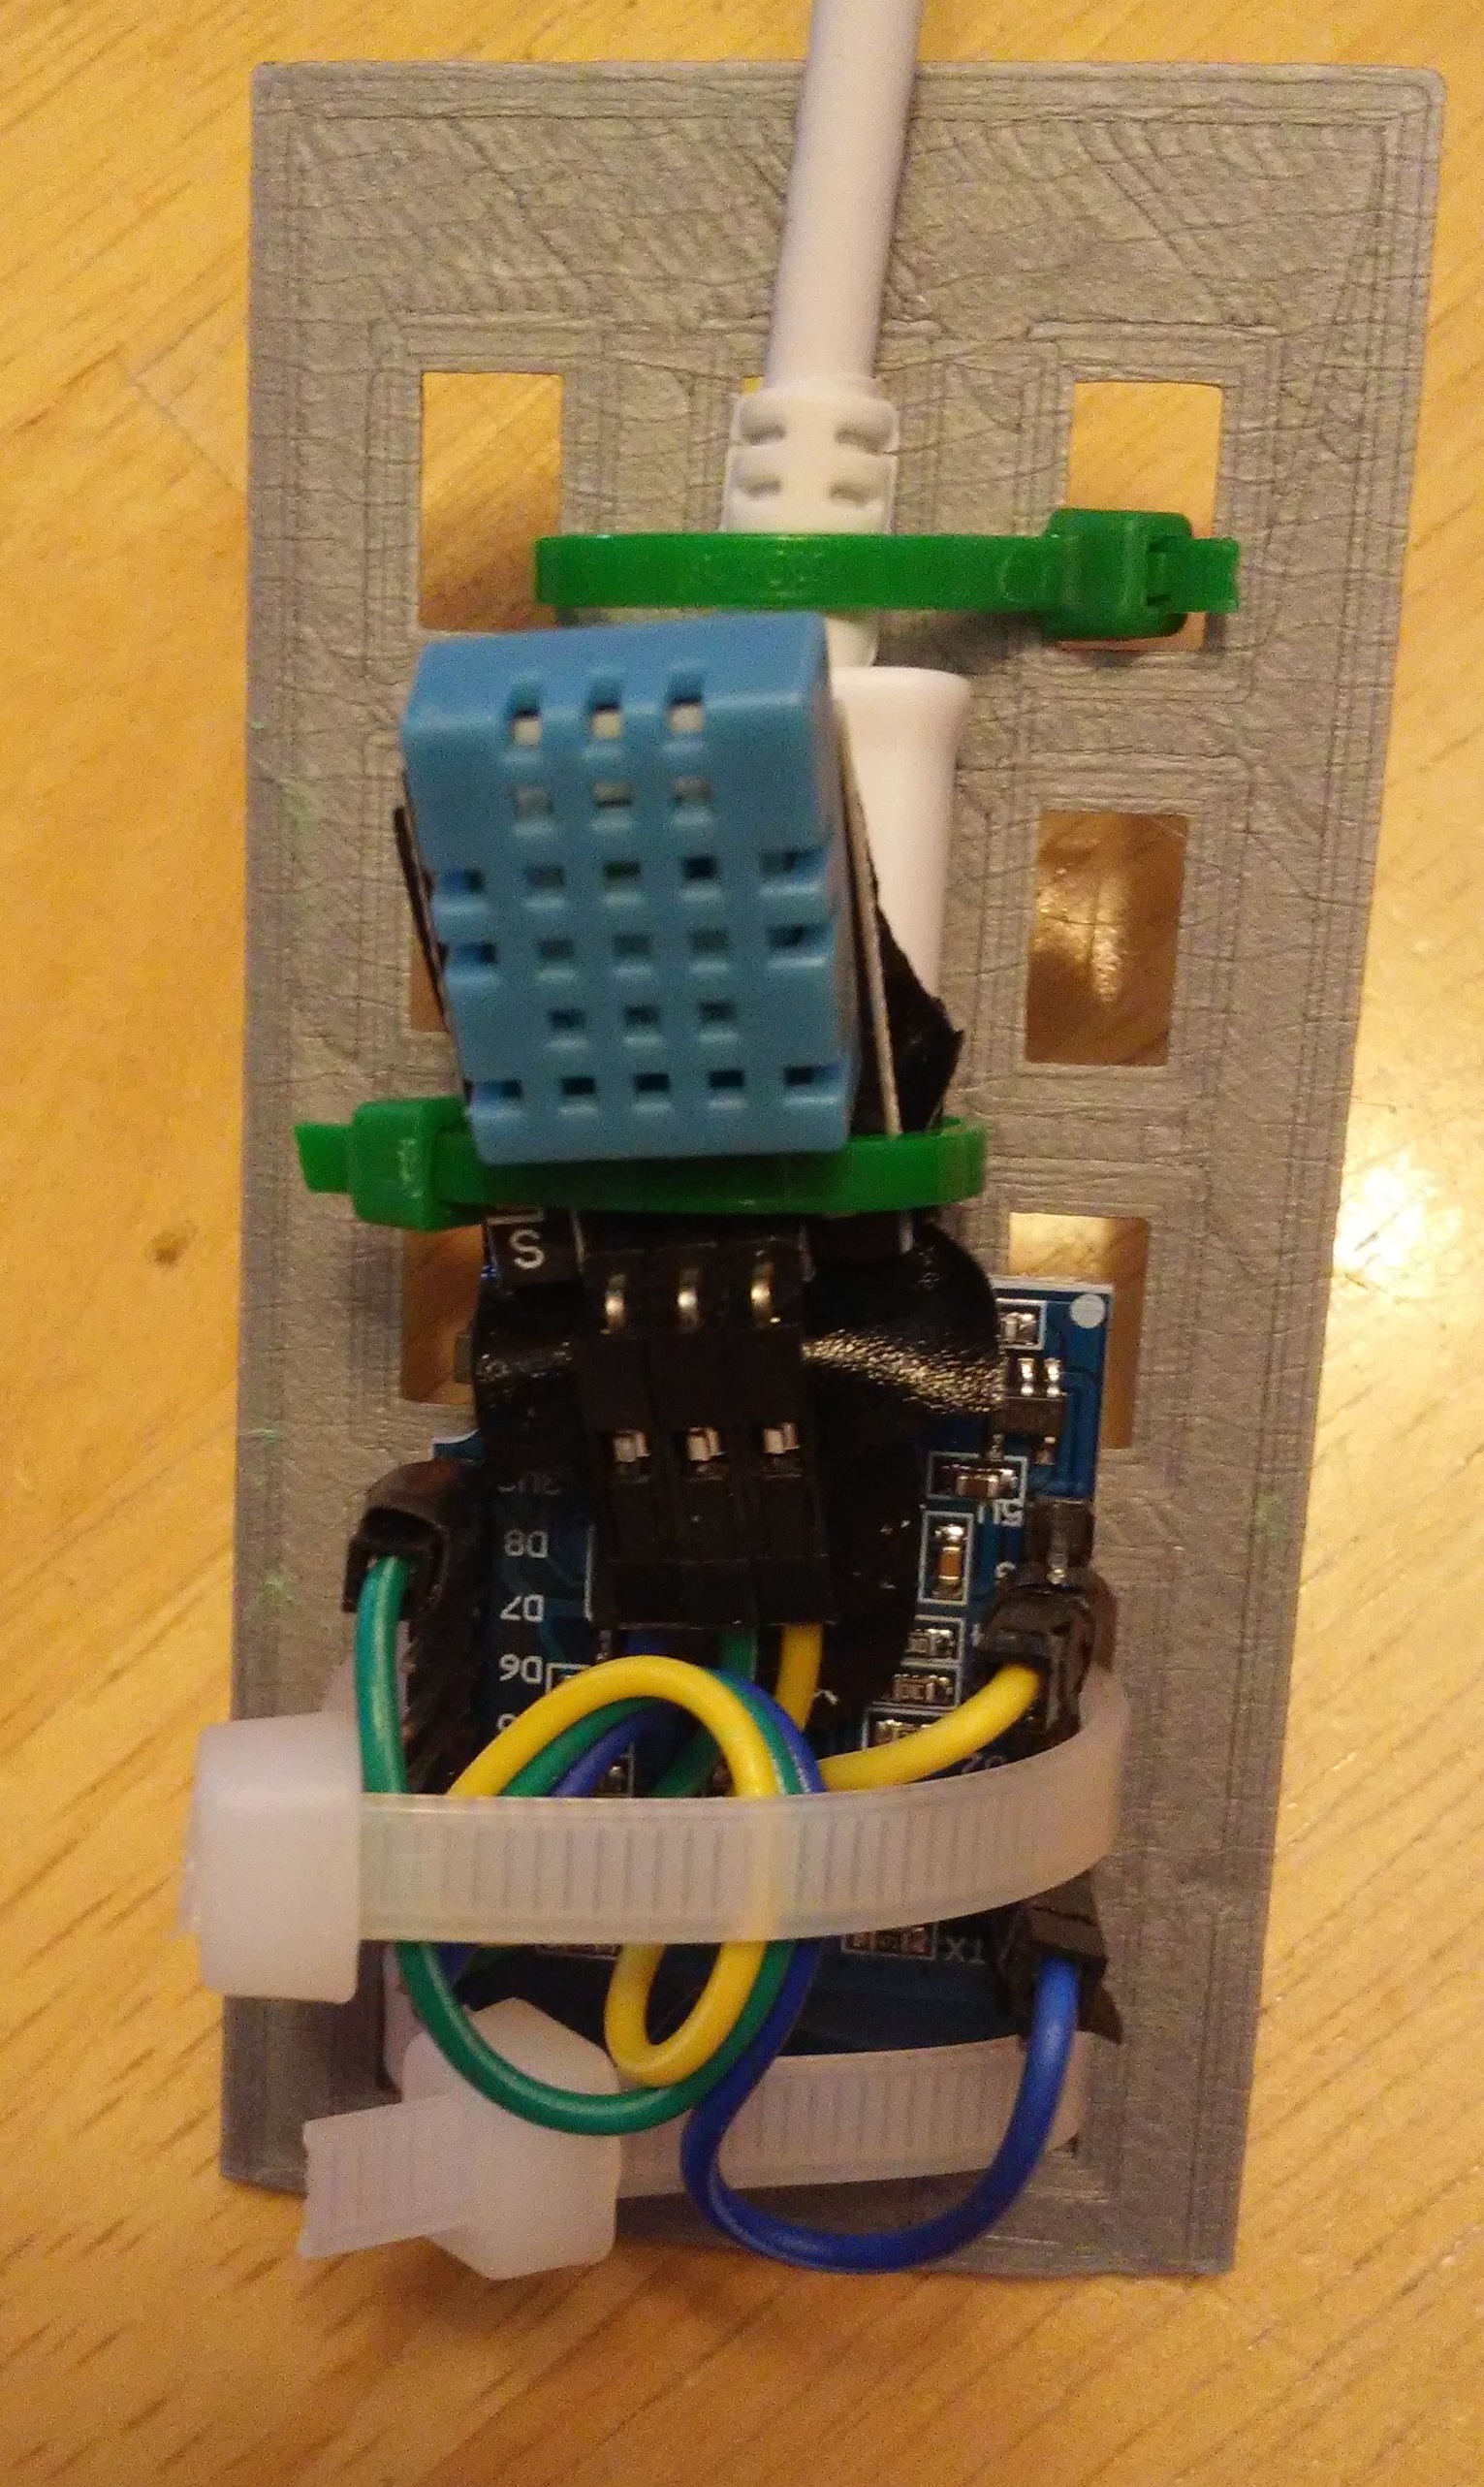
If you’d like to learn more about these two parts used in the project, please see my Further Information section below for datasheets and helpful technical information, including pin out diagrams.
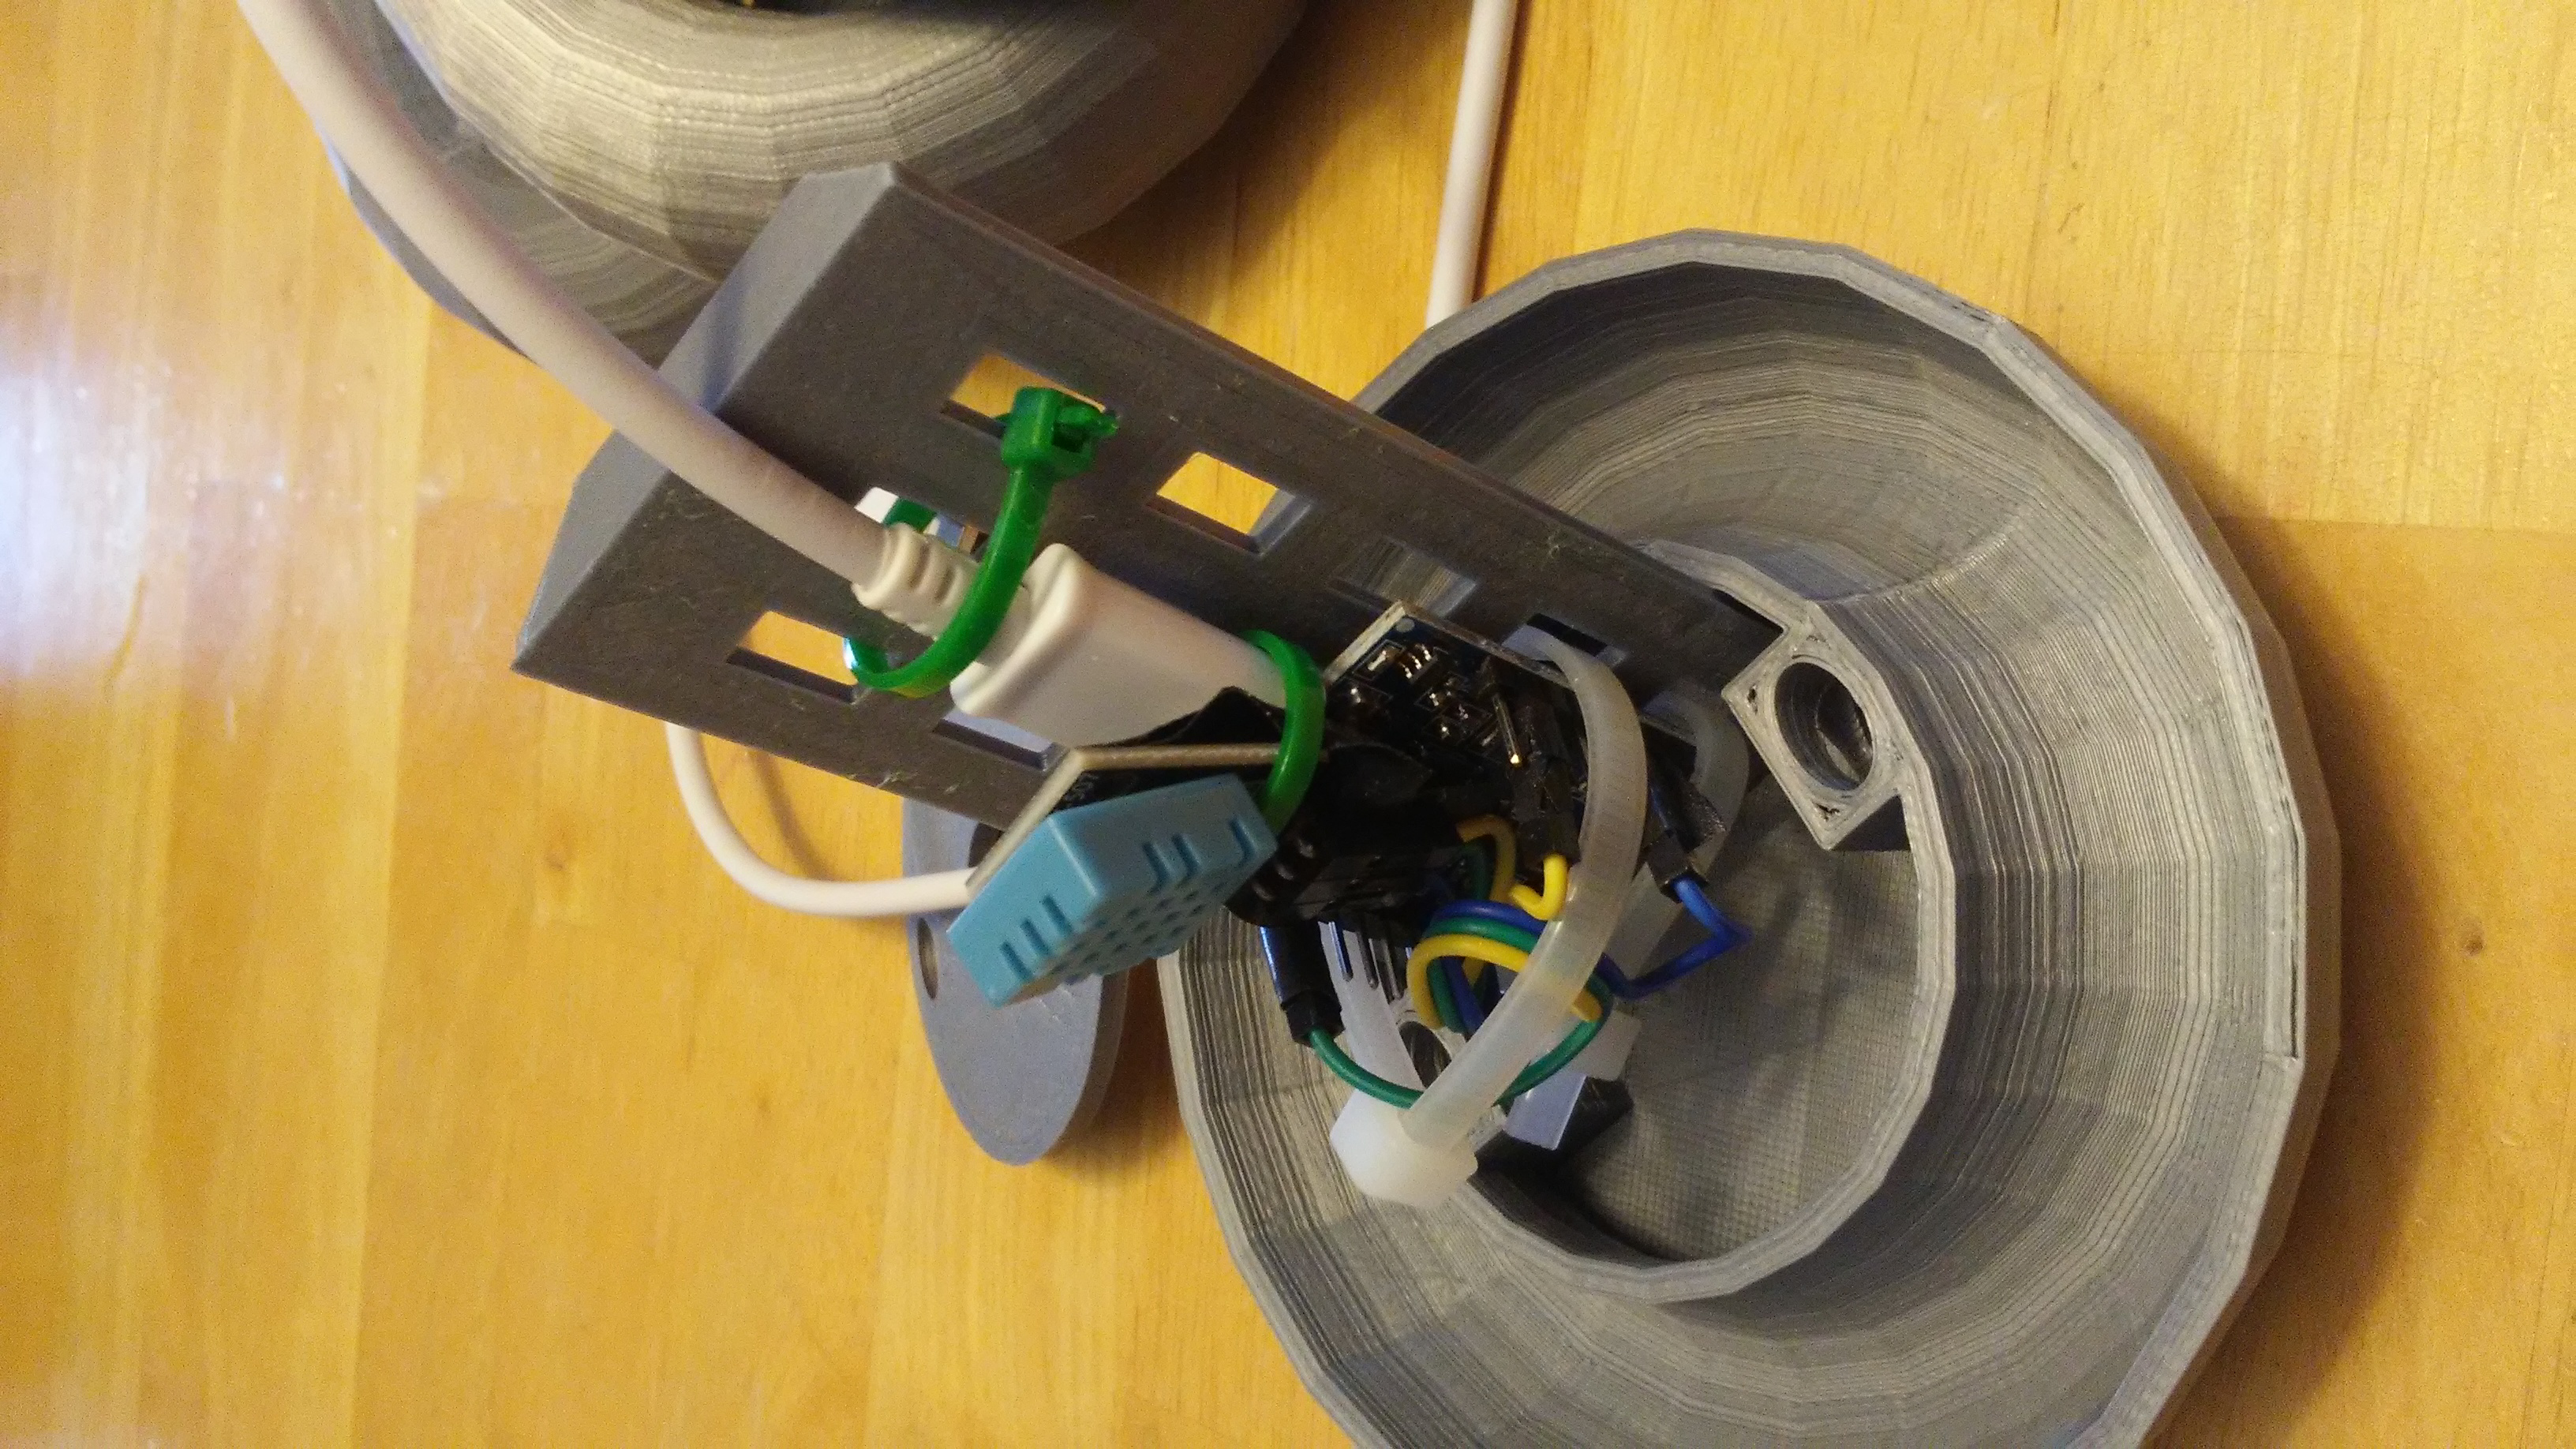
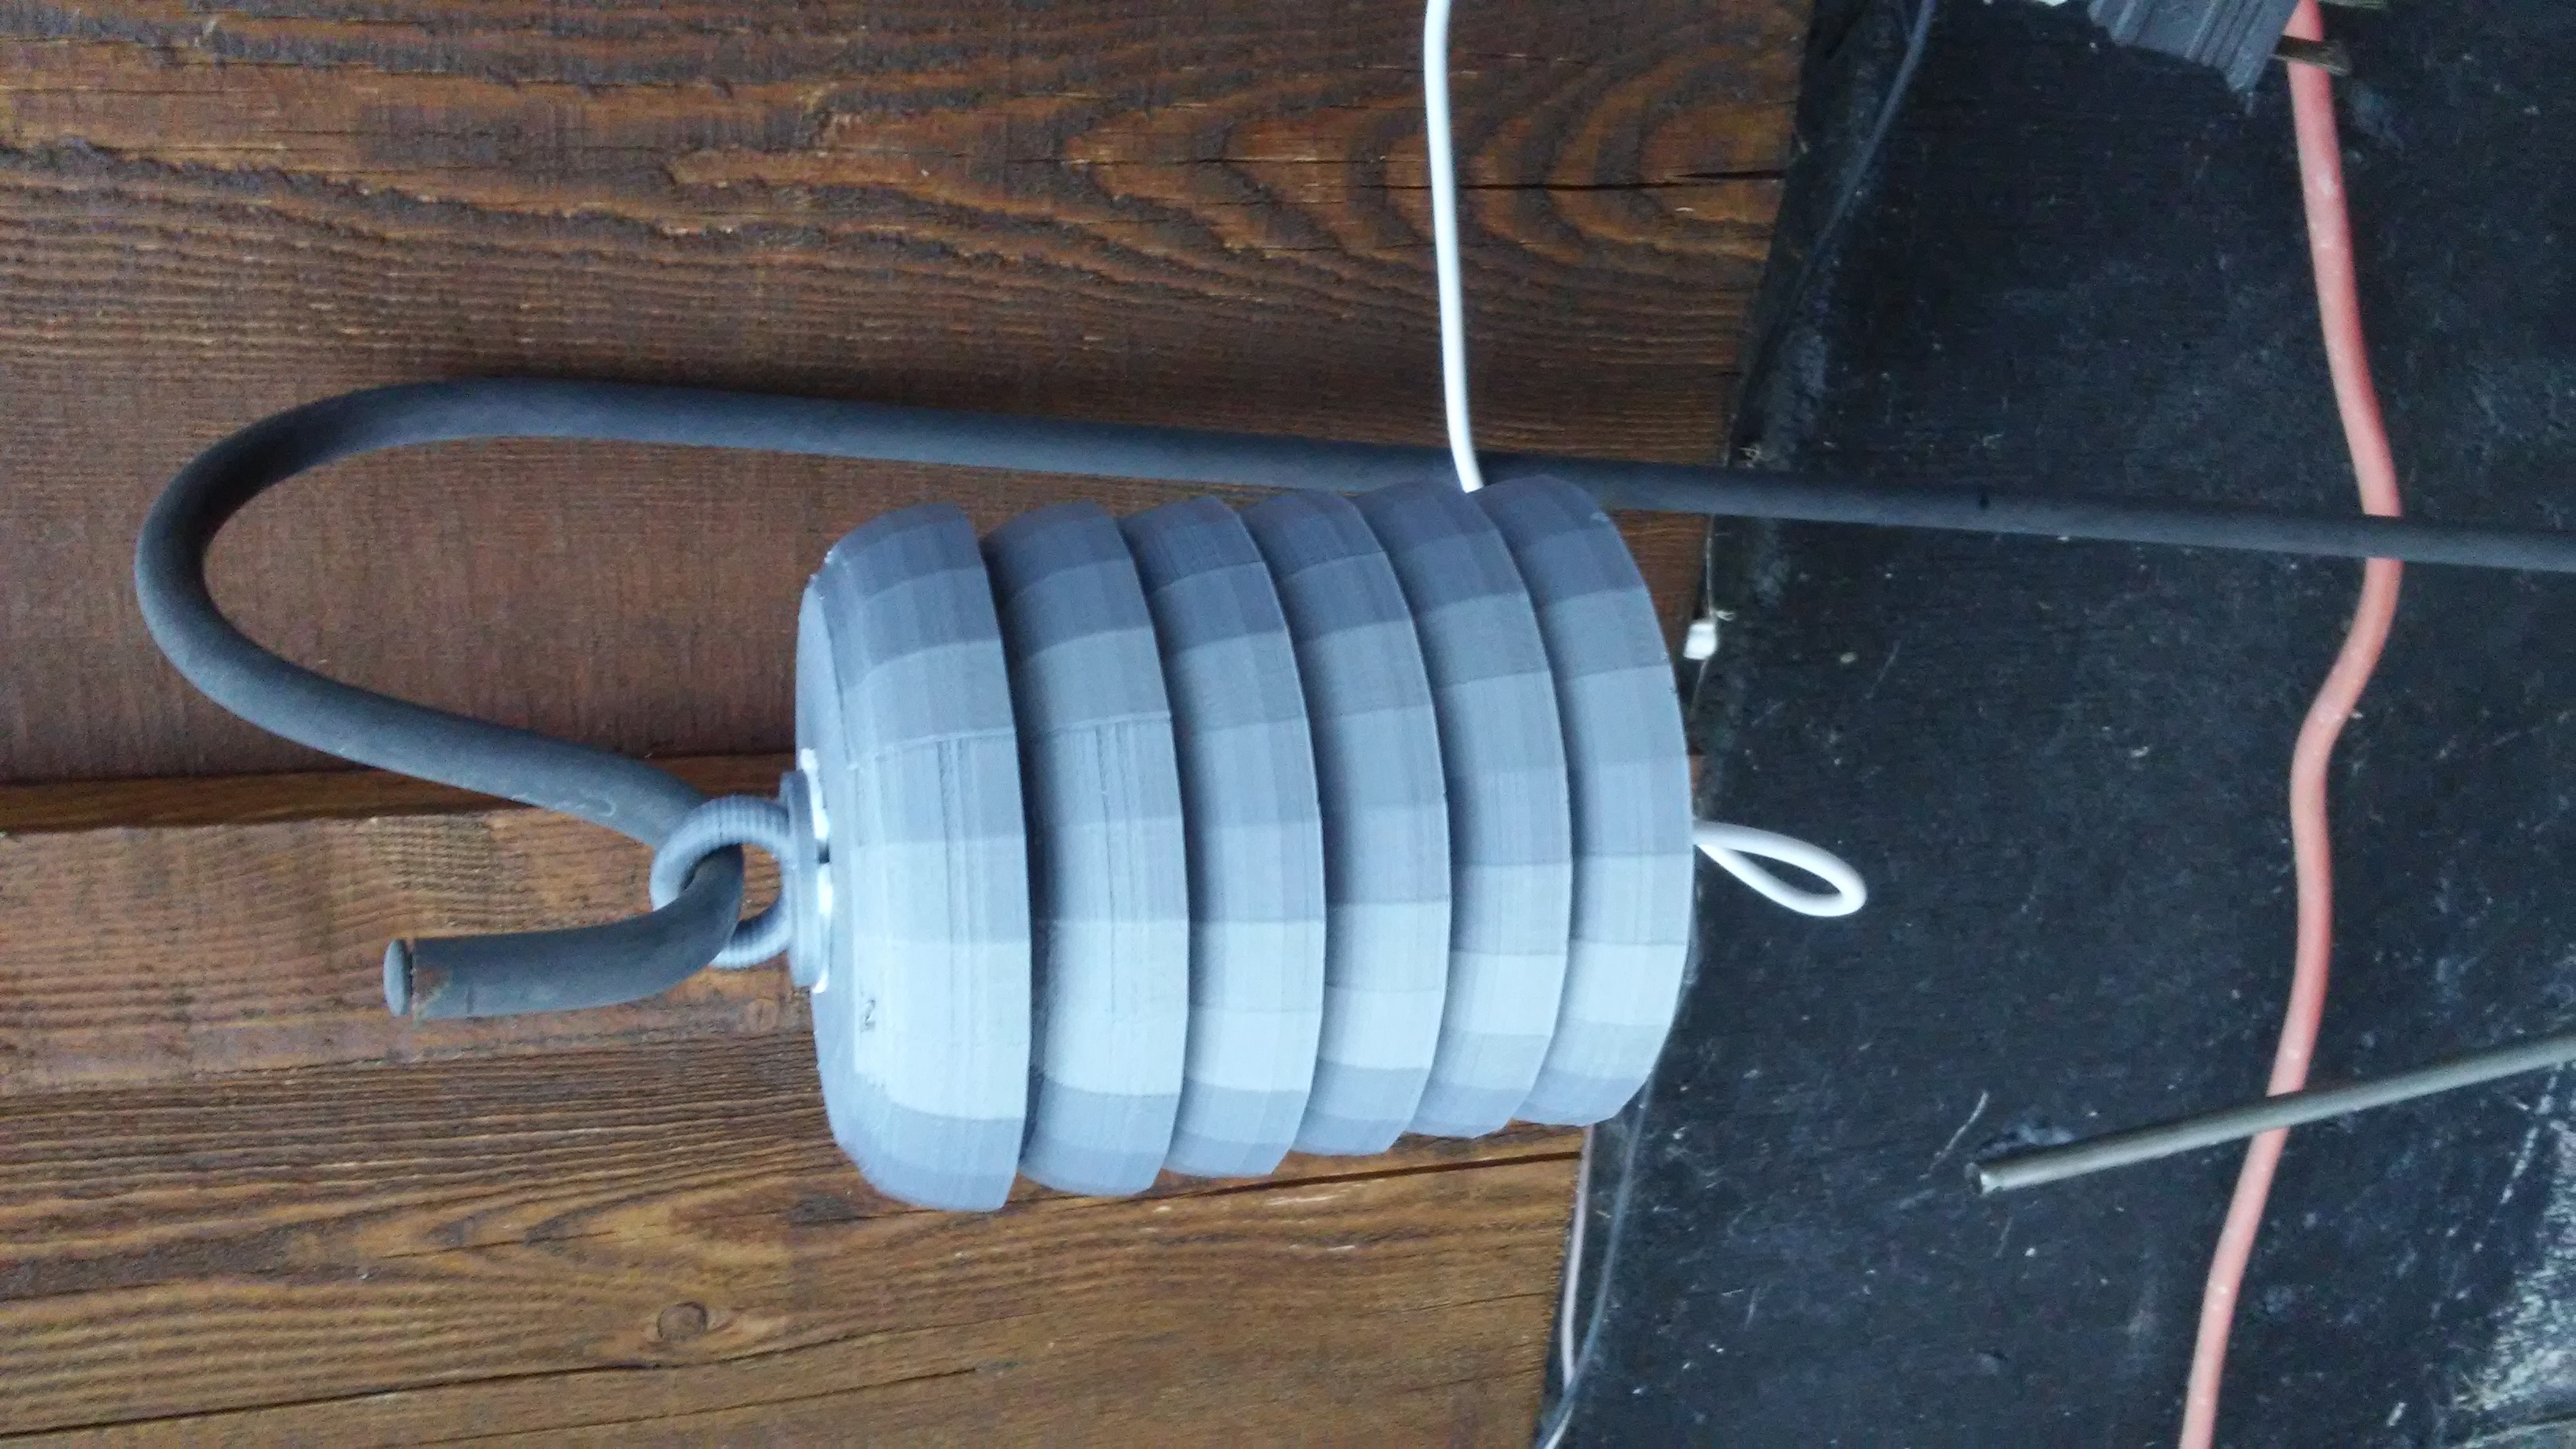
To protect the sensor from the elements, and to prevent both direct and reflected sunlight from shining on the sensor and producing a higher than actual temperature reading, a housing was required. A design with double louvers known as a Stevenson screen is commonly used to prevent sunlight from shining on weather sensors, enabling you to measure the actual air temperature without influence of direct and reflected solar radiation. Since I required a Stevenson screen to house my project, I designed my own 3D printable one, shown below.
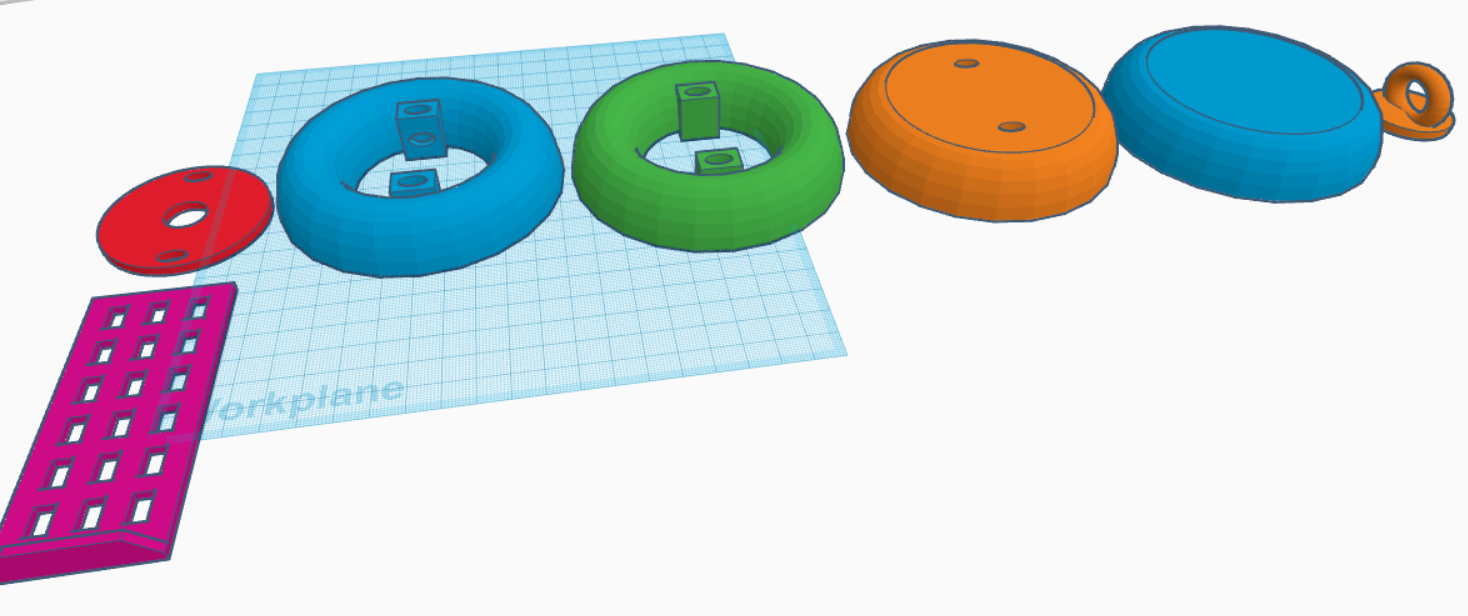
The Stevenson screen housing I designed has 7 unique parts, and can be scaled to fit as tall a sensor as needed by simply printing more of the central piece, and thus this design can be reused in the future by myself and others for various projects.
The Live Data
Below is the live data coming from the two sensors, showing plots of temperature and relative humidity, as well as the current temperature and humidity values for each sensor. Each sensor posts new data every five minutes. A custom Google Map I put together shows you the location of each sensor as well.
|
Sensor 1 - Plot of temperature over time. |
Sensor 2 - Plot of temperature over time. |
|
Sensor 1 - Plot of relative humidity over time. |
Sensor 2 - Plot of relative humidity over time. |
|
Sensor 1 - Current temperature. |
Sensor 2 - Current temperature. |
|
Sensor 1 - Current relative humidity. |
Sensor 2 - Current relative humidity. |
|
Custom Google Map showing the approximate location of both sensors. Please note that if you're signed in with your University of Lethbridge Google account you won't be able to view the map as the University of Lethbridge has blocked Google Maps on their accounts. Simply sign out of your account, and the map will be viewable publicly. |
|
How to Get and Use the Data for Your Own Class/Projects
Below you’ll find download links to download data sets containing the temperature and humidity data from either sensor 1 or sensor 2. The data is enclosed in a CSV (comma separated value) formatted file, which can easily be opened in most common spreadsheet software such as Excel, OpenOffice Calc, and Google Sheets.
Over time as the sensors gather more data, I will continue to add newer, larger data sets for download here.
Posted data sets not recent enough? Want data for something that happened in the last 8 hours (the most recent ~100 data points)? Click the following links to the Sensor 1 or Sensor 2 ThingSpeak pages directly and click the Export Recent Data button above the data readouts. You’ll then be able to download approximately 100 of the most recent data points, again in CSV format.
Rationale and Links to Research
While I could have simply used random data from a book, or less detailed weather data from roughly our area from an online source, I wanted to build a system that would allow me to present students with data from their areas, recorded in places they could see and know exactly where that data was coming from in their town. By building multiple sensors too, I wanted to present students with the reality that weather varies even around their town, not just varies on the big scales we see on the weather maps of our country.
My hope with using the real, recent/live local data was that it would give students more motivation to learn from, and to use, the data since it’s not just some random table pulled out of a book. From my research I found papers supporting my hopes. As explained by Sugimoto, Turner, and Stoehr, the relevance and benefits of real data being used to teach mathematics, include “enhanced student motivation, engagement, and achievement… deepened understandings about the role of mathematics in family, community, and cultural practices… and increased opportunities for student collaboration” (Sugimoto et al., 2017). That article also points out though the difficulty posed to teachers to use real data in the classroom due to the “Lack of Curricular, Relational, and Personal Resources to Support Connections” (Sugimoto et al., 2017), which gave all the more reason for me to do this project. While it might initially be seen as a con for this project, with the huge time commitment required to initially create a system like this for use in teaching, by creating it prior to full time teaching I am able to have it ready for when I am needing it for teaching in the future. Not only does this benefit me, but also other teachers who may not have the same background in data and sensor development, as they can still use my local, relevant data based on the explanation in my section titled How to Get and Use the Data for Your Own Class/Projects above. Since my data is publicly shared it can also benefit any learner, whether school aged or within the general public, who wants to use my data to further their own learning. That has been one of my biggest goals, both in my previous sensor projects during my first degree in physics, and now as an education student as well, is making sure that the data is publicly available and shareable should someone out there want to make use of it.
I also found an article by Hammett and Dorsey, which presents their experience using real data in the classroom as well as some tips on a successful implementation (Hammett & Dorsey, 2020). One of the main tips provided is described as the “big data ‘Goldilocks zone’” and notes that “preparing students for a future drenched in data means dipping them into the data pool - but not drowning them” (Hammett & Dorsey, 2020). I think this is certainly an important consideration, and is something I address in my differentiation options in my lesson plans below. As per constructivism from the perspective of educational psychology as well, I’ve aimed for my lesson plans in the next section to scaffold students into being able to do more and more complex tasks after each lesson. I hope this will be able to engage students, and ensure that students don’t disengage by becoming lost on complex subjects since they’ll be scaffolded into them, especially as Hammett and Dorsey do note that students benefit from starting with smaller data sets and then building up to bigger ones such as longer time frames (Hammett & Dorsey, 2020).
Another tip in the article is about the benefits of making sure the data is relevant and personal for the students, noting how they used a project relevant to the students surrounding 4 environmental issues (Hammett, & Dorsey, 2020). By using the climate data harvested locally, in locations that students know, I hope that my project can achieve a similar kind of relevance to students like Hammett and Dorsey’s project has, and increase student interest, motivation, and drive.
For introducing this unit to the students using the sensor data, I hope to hook them by showing the students recent noteworth data (for example a recent storm) while introducing the sensors, as well as the GPS location of the sensors on Google Maps and Google Streetview. My hope is that the students will see that connection to their actual surroundings from the start, helping students see how the information is relevant to them and their lives and thus hopefully increasing student motivation and interest as happened in Hammett and Dorsey’s article (Hammett & Dorsey, 2020). Since in my lessons students will be working with real data from our direct surrounding environment, it was a great opportunity to link the science and math curriculum for grade 10, while also reinforcing concepts from grade 9 math and covering some of the information and computer technology outcomes at the same time.
For someone like me, who builds these sensors for work and for fun, incorporating this into the classroom is a fantastic way to build connections with students by showing my true passions and giving them a view into my life. As per TQS 1 – Fostering Effective Relationships, I believe projects like this will help me connect with my students, but also help students connect with their community as well. Since students are working on data about their community, and producing graphs about the weather in their community, this would work great as a way for the class to reach out to the public. The class graphs could be shared with the community to show what students are learning, both for parents to see and anyone else in the community.
Lastly, an affordance granted by this integration is the ability to revisit these activities again with larger data set down the road to help students cement these critical skills of graphing and data analysis. As per constructivism, repetition is often beneficial to help in the retention of knowledge and skills. Since we have the real-world data that is evolving as the weather changes outside, it can continue to relate and be relevant to the students, and can be a project we revisit when something big happens weather wise (for example first snowfall of fall/winter, or a really hot week of weather) to take advantage of that relevance and relation to the students to try to engage them with the content.
While I’ve kept this research portion of this rational section primarily focused on academic sources, I also researched and consulted extensive practical resources while constructing the sensors and presenting the data. These resources can be found below in the Further Information section, for I wanted to keep this section focused on the education aspect of the project.
Education Activities Using Sensor Data
Below I’ve constructed lesson plans for learning activities using the sensor data, including student exemplars for those activities. Within the lesson plans are the curricular outcomes addressed by that lesson, as well as differentiation strategies.
This first lesson plan is a great starting activity as it can get students connected and relating to the environment by seeing the data, and also allows them to begin getting comfortable with the basic aspects of graphing in Google sheets. This lesson is also adaptable based on the class’ experience with spreadsheets such that it can either be led by the teacher demonstrating how to do each graph on screen and comparing the outcomes of each graphing method for the weather data, or can allow students to explore the graphing methods themselves if they have enough experience with spreadsheets.
Below is an example of what a student exemplar would look like from this first lesson.
The second lesson is shown below.
Below is an example of what a student exemplar would look like from the second lesson.
The third lesson is shown below.
Below is an example of what a student exemplar would look like from the third lesson.
Other future activities could expand the data using other sensors, discussed in the section below, for example having students try to correlate weather changes with wind speed and direction, as well as having students incorporate images with their data, images which would be taken by the students or by future sensors I plan to construct.
What Comes Next?
There are many ways I’d like to continue and enhance this project in the future. Below I list a few of these ideas.
- Other sensors such as:
- wind speed
- wind direction
- MATLAB and Maple Integration
- Since ThingSpeak, the service used to host and receive the sensor data, is made by Mathworks, the same company that makes MATLAB, integration of ThingSpeak data with MATLAB is built in and could be great in higher level high school mathematics and science courses for data analysis. Maple, another mathematical programming language, could also be used in those higher level classes to analyze the weather data.
- Fieldtrips to Sensor Locations or to Place New Sensors
- As was recommended to me by Professor Steed, a field trip for my future class to place new sensors, and to visit previous sensor placements, could help further build that connection and relevance of the data to the students, so they see the data from the sensor they helped setup and their ability to relate to, and connect with relevantly, the data from the location they went to and observed.
- Comparing Drastically Different Locations
- By placing sensors in drastically different environments, say at the top and bottom of a valley or coulee, students could engage higher order thinking skills to understand why there might be such vast changes in climate even if the two sensors are close to each other.
- Classroom and School Data Displays
- I’ve already started planning and designing a small, live sensor display for my future classroom. It will have a data readout, similar to the one above, with live graphs and current sensor readings. It will be incredibly low cost, simply consisting of an old LCD monitor and a low power single board computer such as a Raspberry Pi.
- Grade 12 Sensor Programming
- For a grade 12 programming class with very experienced students, a project around building sensors similar to the ones I've designed could be a useful and challenging task for students. I will investigate making lesson plans on this topic in the future.
- ESP32-CAM Based Image Capture System
- Utilizing the ESP32 microcontroller based ESP32-CAM development boards, I’d like to construct extra sensors for an image capture and storage server that students could have access to when doing their graphing. As Professor Steed suggested, this would give a way for students to connect with their environment again even further, hopefully further enhancing student engagement as well, by linking events in the data to seen weather events. Students could even embed images into their Google Sheets graphs and as part of the explanation link those images to those times on the graph when those images were taken, and apply higher order thinking skills to have to figure out why those events took place and why those changes in the data resulted in what was visually seen in the picture, or vice versa.
- This will provide a large learning challenge for me as well, as image processing, especially on such low powered hardware as an ESP32, is no easy task and something I find myself severely lacking experience writing code that processes images. It will also be a large learning task for me to setup a secure, reliable, and accessible network attached storage server for these pictures captured by the ESP32-CAM modules. This development project will help me to be able to broaden my experience in programming and enterprise information technology to be able to teach more subjects to students, both within the normal school system, and at the college where I currently teach summer classes.
Reflection
In this project I successfully completed my goal of constructing weather sensors for education and developed methods of retrieving/presenting the data for use by students, fellow teachers, and the general public. I successfully made my data, as well as 3D printed designs, available for anyone to use to further their own learning.
This project was a fantastic learning opportunity, and an especially useful one since I completed my goal of construct a sensor system that I will now be able to use in my future classroom. This sensor system is now something I can continue to make further lessons around using at various grade levels too. The sensors, as well as the lessons and skills I learned from developing this project, will be useful throughout the many different classes I will teach in the future.
The project was not without its difficulties, and certainly pushed me to have to learn more throughout the entire project. From sensor and programming knowledge, to delving more into the curricular outcomes of high school mathematics and science courses, to learning to present data to be accessible to students and the general public, this was a great learning experience getting to dive right into a real project.
In my research of the topic, I found papers with real world evidence supporting this use of relevant information to students to enhance engagement (Hammett & Dorsey, 2020; Sugimoto et al., 2017). Now that I have this system built, something I might not have the time to do during a normal semester when teaching full time, I can put this sensor setup to use at a moment’s notice to engage students in great learning in subjects such as mathematics, science, and information technology. This system will also allow me a great way to link different classes, like mathematics and science, to collaborate on a project to help students satisfy many different curricular outcomes in an engaging, relevant, and applicable manner to my future students.
Further Information
- Sensor 1 on ThingSpeak.
- Sensor 2 on ThingSpeak.
- My personal sensors website with other kinds of live and recorded sensor data.
- Sensor and Microcontroller Documentation
- DHT11
- Data sheet.
- This data sheet provides the relevant information about the DHT11 sensor, capable of both temperature and humidity measurements. It was useful in this project as it provided the information that sensors were already factor calibrated (though I confirmed this calibration in lab using a Fluke K/J thermocouple reader). It also provided the me with some of the most important information on the sensor, that the operating voltage and the data signal voltage both support a range from 3 volts to 5.5 volts, making it compatible with the ESP8266’s 3.3 volt data pins.
- Wemos D1 Mini - ESP8266 Based Microcontroller Documentation
- Wemos Database.
- Official Wemos D1 Mini microcontroller board specifications are listed at the above link. This was useful in planning to ensure the microcontroller and sensor were compatible.
- Pinout diagram.
- This pinout diagram, linked above, was incredibly useful, as it provided the pinout information for the microcontroller module for various use cases. This is important, as depending on your code and what kinds of sensors you’re working with, different pin numbering schemes may be required or specific pins may need to be used for various hardware features. This was an issue I encountered, and had to troubleshoot, during this project.
- DHT11
- Stevenson Screens
- https://www.canada.ca/en/environment-climate-change/services/sky-watchers/weather-instruments-tour/stevenson-screen.html
- https://www.weatheronline.co.uk/reports/wxfacts/The-Stevenson-Screen.htm
- The above links provided me with good introductions to Stevenson screens. They are tried and true containment units to protect weather sensors from the elements, as well as shield them from being affected by direct sunlight. This way, temperature sensors for example are measuring the actual air temperature, and are not being influenced by incident and reflected solar radiation on the sensor’s surface.
- Google Sheets Graphing and Data Analysis
- https://support.google.com/docs/answer/190718?hl=en
- This link above is to Google’s documentation on their various graphing options.
References
- Hammett, A., & Dorsey, C. (2020). Messy Data, Real Science: Exploring Harmful Algal Blooms with Real-World Data. Science Teacher, 87(8), 40–48.
- Sugimoto, A. T., Turner, E. E., & Stoehr, K. J. (2017). A Case Study of Dilemmas Encountered When Connecting Middle School Mathematics Instruction to Relevant Real World Examples. Middle Grades Research Journal, 11(2), 61–82.